
OpenTelemetry with Quarkus to push distributed traces to AWS X-Ray
Distributed Tracing enables a DevOps team to observe user requests as they travel through multiple services and applications in a microservices landscape. It provides a centralized view of how user requests are performing across all involved services. Nowadays, a microservice architecture consists of many self-developed as well as hosted and preconfigured services such as API gateways, load balancers or databases. To get a deep insight into the overall microservice architecture, traces of self-developed microservices need to be combined with traces of hosted services. AWS X-Ray can be employed for this purpose, but it adds a vendor-specific javaagent to the application. Alternatively, OpenTelemetry can be used to get traces from self-developed applications and push them to AWS X-Ray. The result is similar, traces can be observed for the entire microservices landscape, but it avoids adding the AWS X-Ray javaagent to the self-developed application.
OpenTelemetry is the new shining star on the Observability horizon. It aims to standardize the three pillars of observability: Tracing, Logging, and Metrics. OpenTelemetry is a set of vendor-independent APIs and SDKs for collecting and exporting telemetry data. To obtain distributed traces of an application, only the general OpenTelemetry interface needs to be integrated without a vendor-specific implementation or library. The three major cloud providers, AWS, Azure and Google, already provide an interface from OpenTelemetry to their hosted tracing solutions. I expect OpenTelemetry to be the only widely used observability API in the future. It already provides good support for tracing and metrics, but they are still working on the specification for logging.
AWS X-Ray has two key advantages over a self-hosted solution like Jaeger: It is a fully AWS-hosted service that includes setup, authentication, and updates. In addition, many other AWS services such as API Gateway or DynamoDB report their traces to AWS X-Ray. This provides visibility into the entire microservices infrastructure, not just the self-developed services.
In this article I want to show how to integrate OpenTelemetry into a Java Quarkus microservice in order to send distributed traces to AWS X-Ray. No javaagent is required and it supports the Quarkus native mode. This solution enables observation of the entire microservice infrastructure, including services hosted by AWS.
The setup consists of four steps:
- Integrate OpenTelemetry into the Quarkus application
- Adjust the Trace-ID generation
- Use the AWS Context Propagation
- Run the OpenTelemetry Collector
1. Integrate OpenTelemetry into the Quarkus application
There are two different ways to instrument an application to get tracing data with OpenTelemetry: autoinstrumentation using a javaagent or manual instrumentation by modifying the code. But Quarkus offers a third and much better option: An extension for OpenTelemetry that automatically collects tracing data.
This is actually very simple and is described in detail in the Quarkus OpenTelemetry Guide. I just want to point out the two changes that actually need to be made:: add the quarkus-opentelemetry-exporter-otlp extension to the pom.xml and configure it in application.properties.
<dependency>
  <groupId>io.quarkus</groupId>
  <artifactId>quarkus-opentelemetry-exporter-otlp</artifactId>
</dependency>
quarkus.application.name=myservice
quarkus.opentelemetry.enabled=true
quarkus.opentelemetry.tracer.exporter.otlp.endpoint=http://localhost:4317
As a result the application can push traces to a OpenTelemetry Collector running on localhost:4317. To forward the data to a local Jaeger instance, please follow the Quarkus OpenTelemetry Guide.
2. Adjust the Trace-ID generation
Every request that hits the microservice application gets a unique Trace-ID. By the specification of OpenTelemetry the Trace-ID is by default randomly generated, but it offers an API to customize the Trace-ID generation:
The SDK MUST by default randomly generate both the TraceId and the SpanId.
The SDK MUST provide a mechanism for customizing the way IDs are generated for both the TraceId and the SpanId.
Source
Unfortunately, AWS X-Ray has a more specific format: It expects a version number and the unix timestamp in the beginning of the Trace-ID. If X-Ray receives a randomly generated Trace-ID it might be silently ignored because it considers the Trace-ID as invalid or outdated.
To solve such issues, OpenTelemetry provides an interface to overwrite the Trace-ID generation. For this purpose, a class must be added to the application that references it.
<dependency>
  <groupId>io.opentelemetry.contrib</groupId>
  <artifactId>opentelemetry-aws-xray</artifactId>
  <version>1.14.0</version>
</dependency>
@Singleton
public class AwsOpenTelemetryIdGeneratorProducer {

  @Produces
  @Singleton
  public IdGenerator idGenerator() {
    return AwsXrayIdGenerator.getInstance();
  }
}
3. Use the AWS Context Propagation
Whenever microservice A calls microservice B the same Trace-ID must be used to report the tracing information in order to link both requests into a single distributed trace. To achieve this requirement, microservice A needs to pass the Trace-ID as part of the request to microservice B. This feature is called “Context Propagation”.
Some AWS services, such as the AWS API Gateway or the AWS Elastic Load Balancer, can be configured to add the X-Ray Trace-ID to each incoming request. Typically, these services are the entry point into the microservices landscape and thus the beginning of the trace context. It is important to use the X-Ray context propagation format to receive the trace context from AWS services like API Gateway or ELB and pass it to downstream services like DynamoDB.
There are diffent HTTP header formats, but the result is the same. The W3C Trace Context is specified by the W3C and is used by OpenTelemetry by default. Unfortunately, X-Ray uses a different, more specific format. However, OpenTelemetry provides an extension for the X-Ray format, so it can be easily adopted.
Add the OpenTelemetry extension to the pom.xml
<dependency>
  <groupId>io.opentelemetry</groupId>
  <artifactId>opentelemetry-extension-aws</artifactId>
</dependency>
and enable the xray propagator in the application.properties
quarkus.opentelemetry.propagators=xray
As a result the traceparent header is changed to X-Amzn-Trace-Id.
>> GET /42 HTTP/1.1
>> Accept: text/plain
>> traceparent: 00-fde5c586b403d130a7cb756ccb05fb02-a01a988d41694782-01
>> Host: localhost:8080
>> User-Agent: Apache-HttpClient/4.5.13 (Java/18.0.1)
>> GET /42 HTTP/1.1
>> Accept: text/plain
>> X-Amzn-Trace-Id: Root=1-641c1bd3-d485eee618a90c8ef3bc3978;Parent=64f85711e0109ce6;Sampled=1
>> Host: localhost:8080
>> User-Agent: Apache-HttpClient/4.5.13 (Java/18.0.1)
4. Run the OpenTelemetry Collector
A key conecpt of OpenTelemetry is the Collector. It is a single service that receives tracing data from an application, processes the data and exports them to the specific backend such as Jaeger or AWS X-Ray. The OpenTelemetry Collector can be deployed as a standalone service or as a sidecar container in Kubernetes and others.
Support for Jaeger is included in the standard version of OpenTelemetry, but it does not come with support for AWS X-Ray. Fortunately, AWS steps in and provides a customization for OpenTelemetry called the AWS Distro for OpenTelemetry that provides AWS X-Ray support. It is quite easy to run the collector as a sidecar in ECS or EKS, AWS provides it as a Docker image along with good documention for various environments. For ECS it is even simpler, the AWS console provides a checkbox to enable tracing support with OpenTelemetry.

Afterwards, the microservice running in ECS can access the OpenTelemetry collector on localhost:4317. Therefore there is no need to change the oltp-endpoint in the application.properties
Observing the results with a sample application
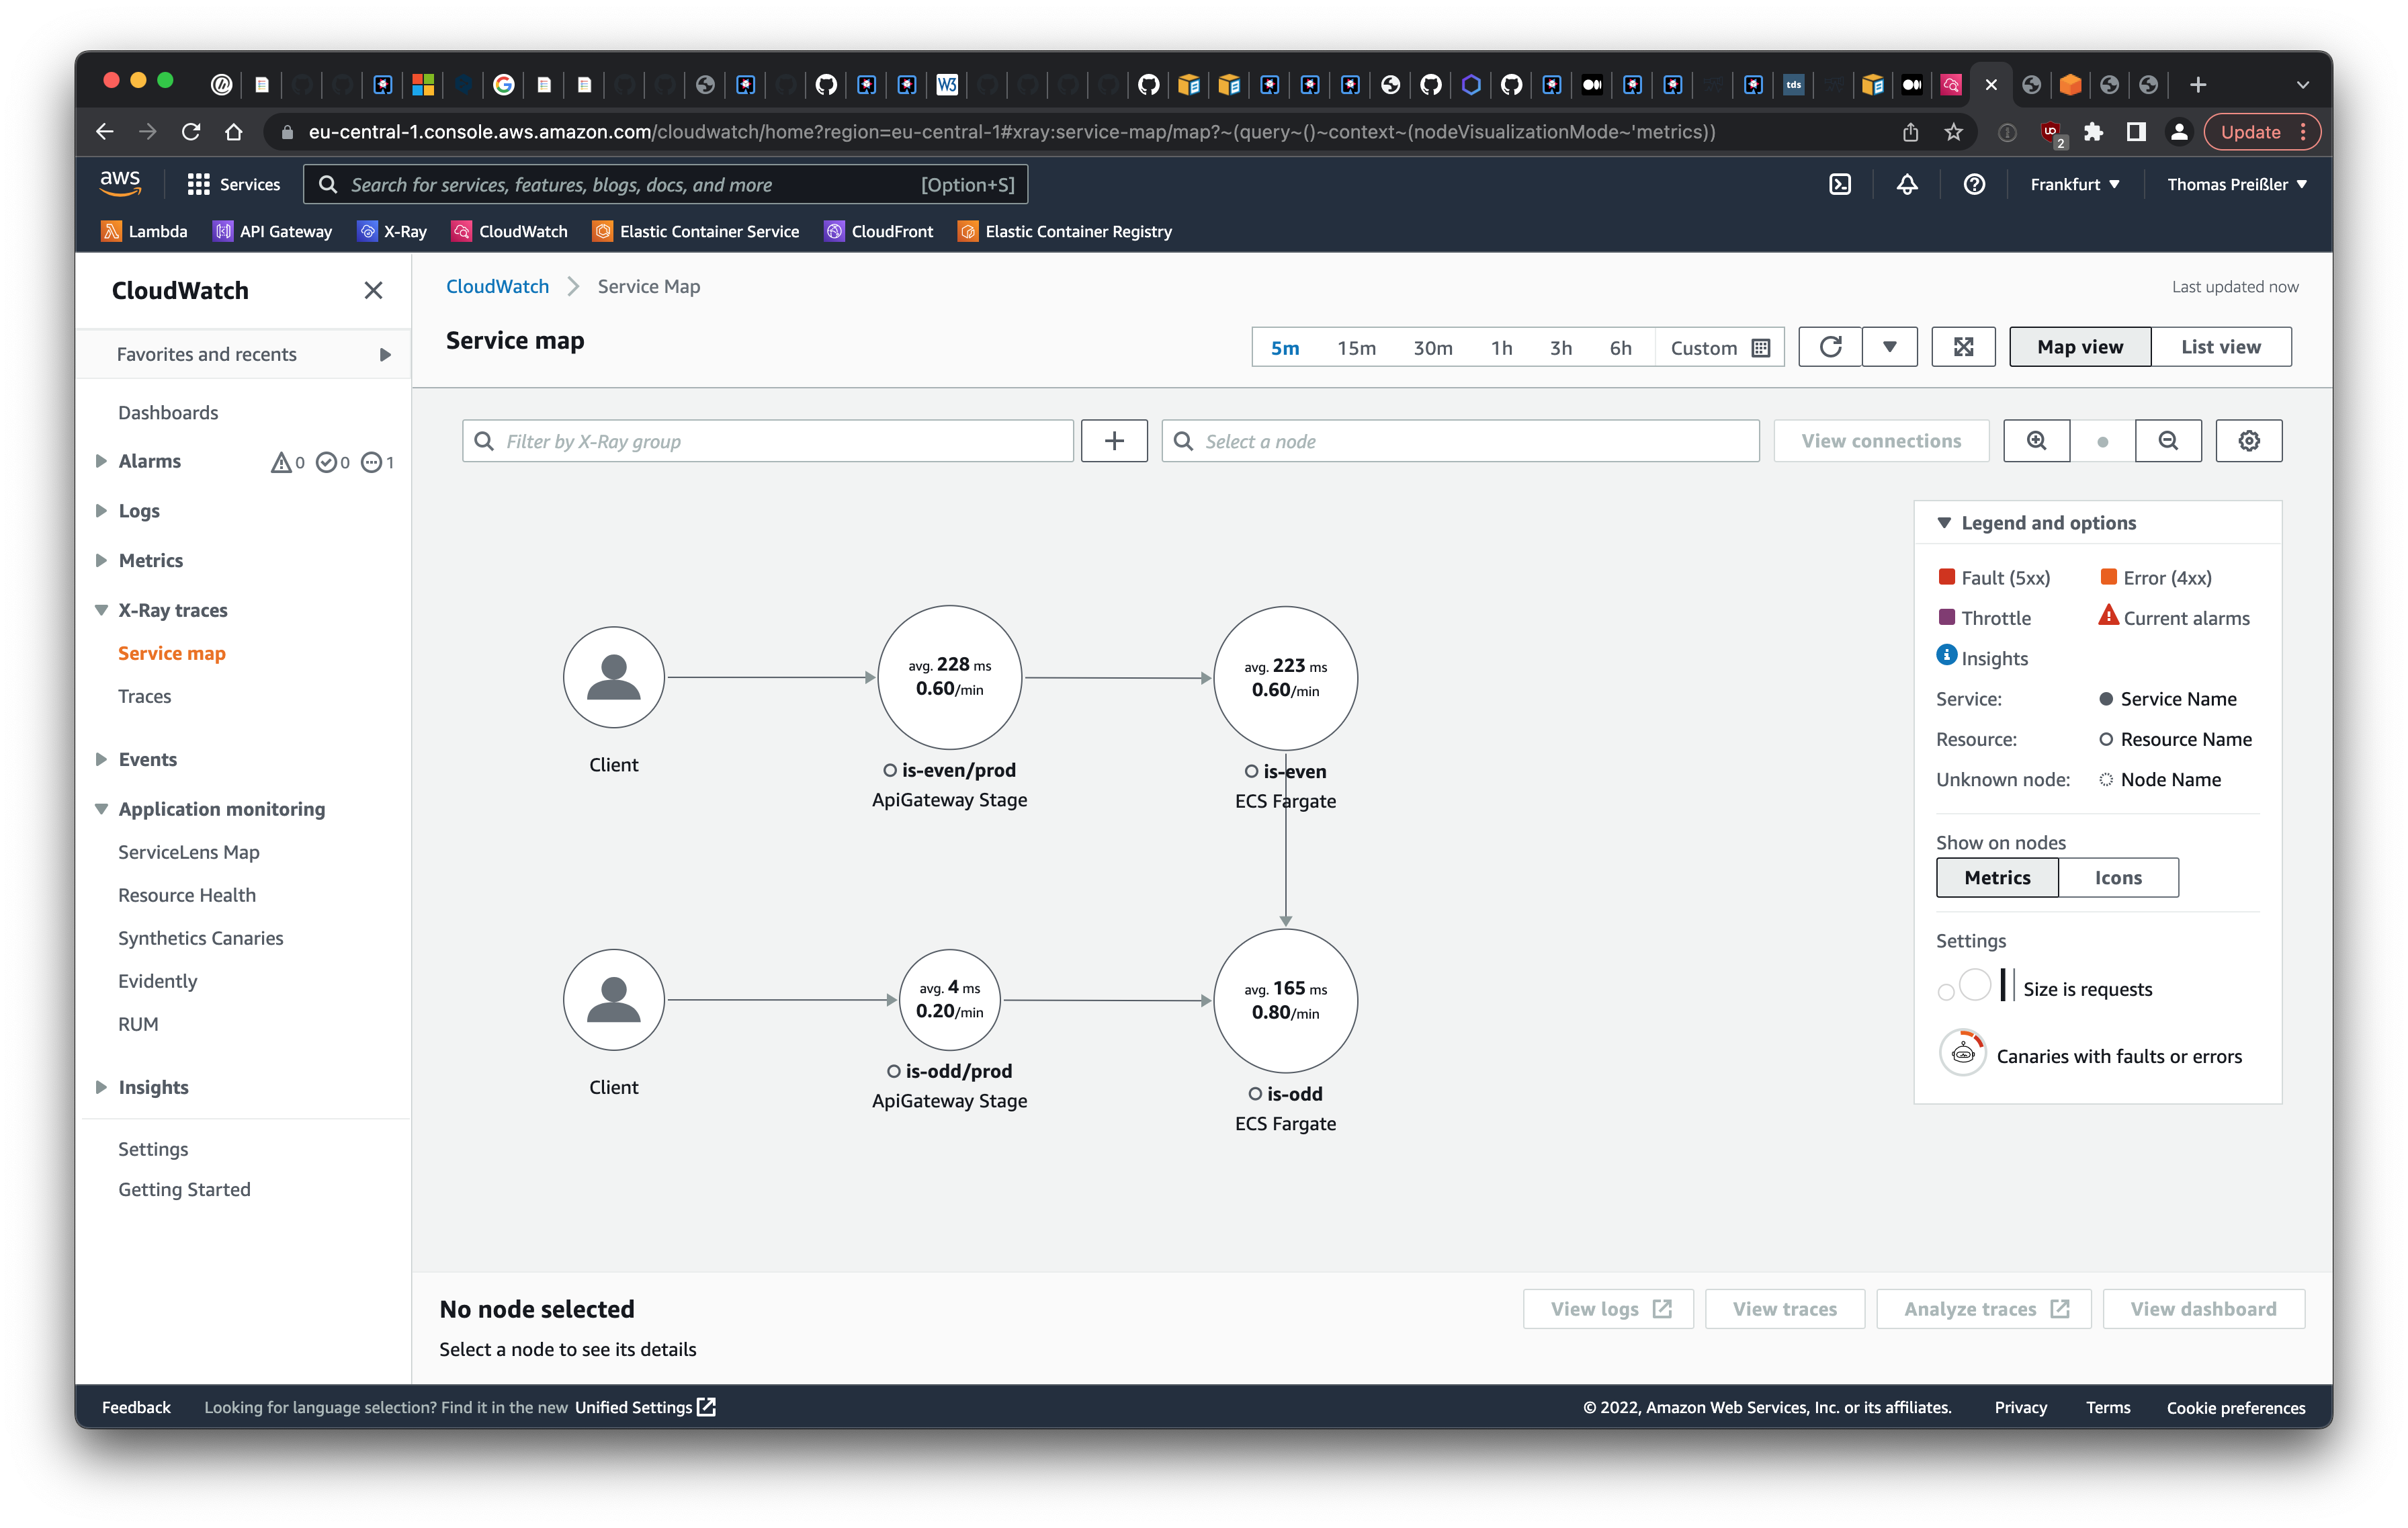
To show the results, I created an almost useful example microservice called is-odd that determines if a given number is odd. Calling the example application with GET /42 returns false. A second microservice is-even uses is-odd to negate its result and indicate whether a given number is even. To complete the overall microservice architecture, both microservices are deployed on ECS and equipped with an API gateway that has X-Ray support enabled. Both applications can be found on Github
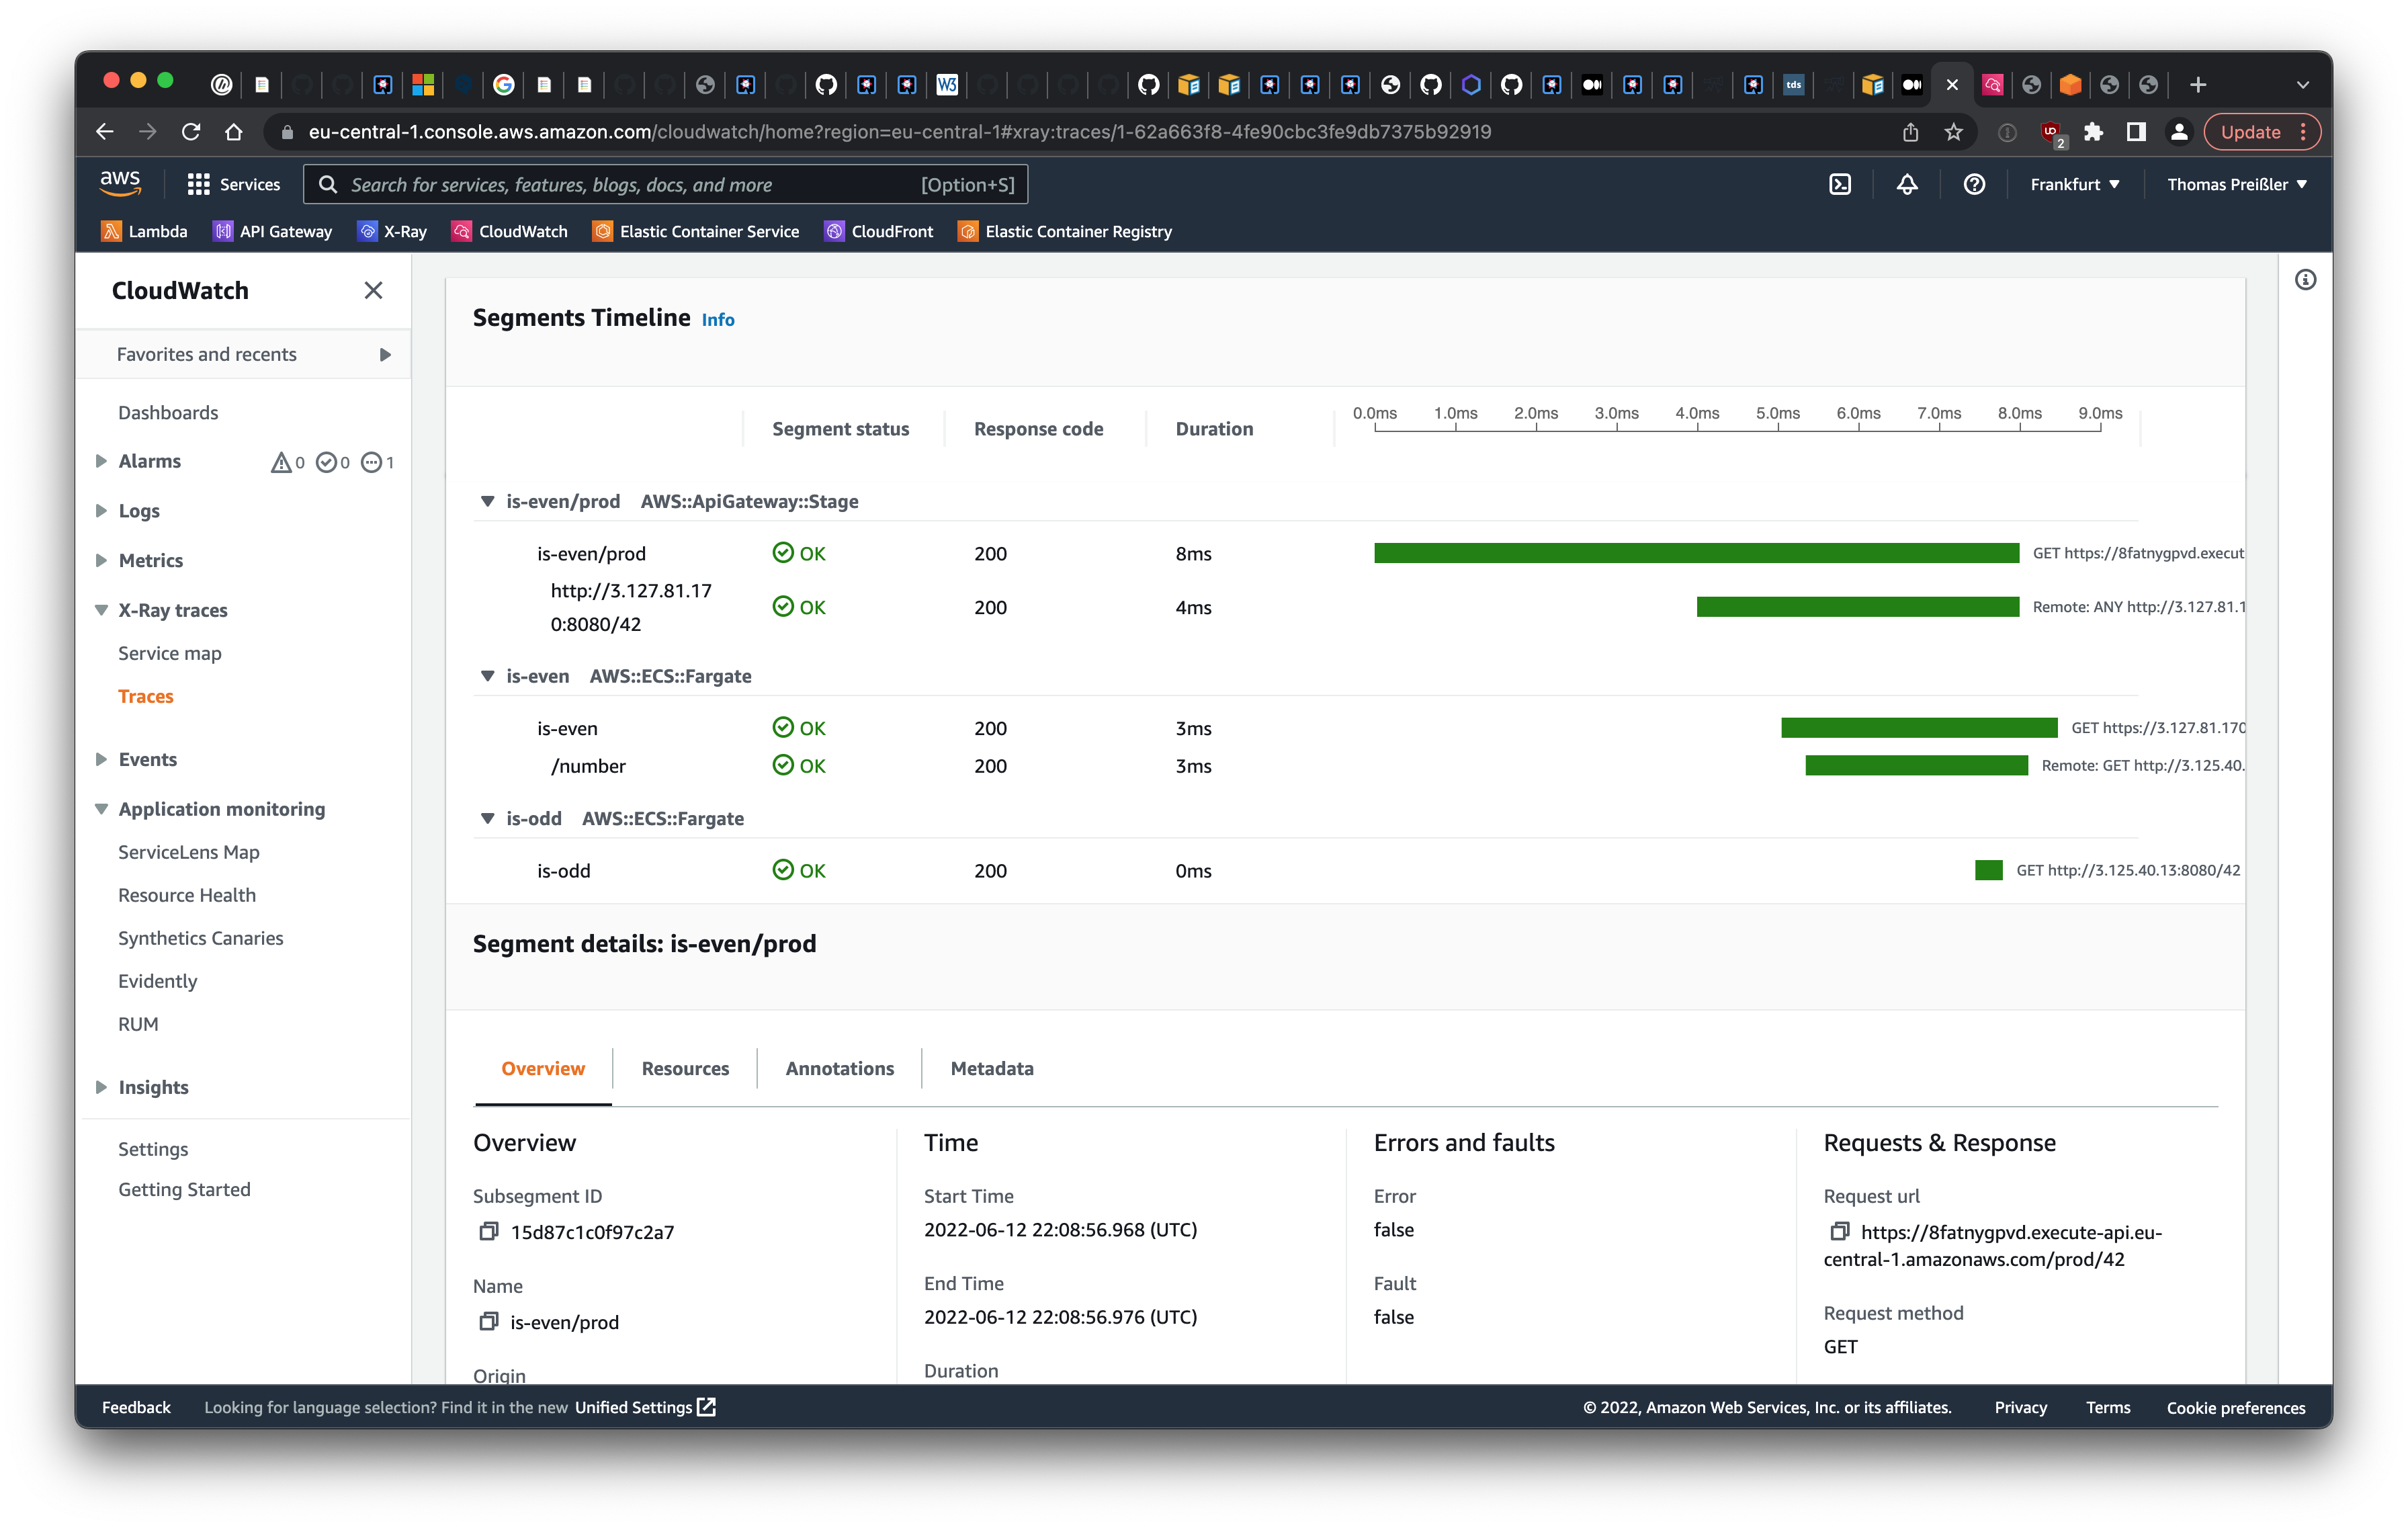
The result is no surprise: both the service map and the segments timeline in CloudWatch show that the request travels from the client through the API gateway to the sample applications is-even and is-odd in AWS ECS. It can be observed that the API gateway causes the largest delay for the request shown in the screenshot, however, the overall response time of just 8 ms is pretty fast.
In summary, the proposed solution offers two key benefits:
- Traces cover the entire microservice landscape, including self-developed applications and AWS-hosted services.
- There is no need to integrate a javaagent. The native executable mode of Quarkus is supported.